What's new at PRISM

Gallery of State Maps
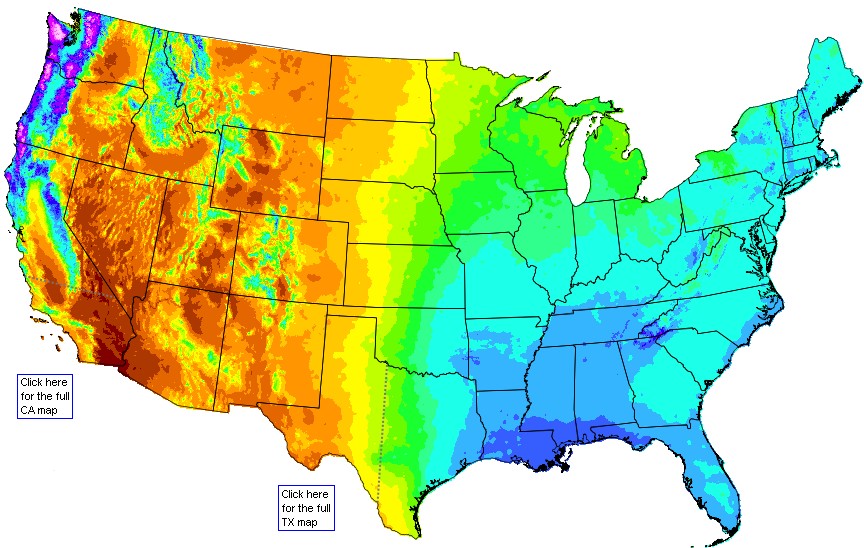
In response to requests for high-quality graphics suitable for printing, annual precipitation maps are available for each of the 48 contiguous states. The 30-year normals datasets are used for this purpose, since they are our most popular data. 30-year normals describe average annual conditions over the most recent three complete decades. See PRISM datasets for more information.
Click on a state to view its map. Each map is available for downloading at two resolutions.
Terms of use

